How to Identify what is queued in DS

There are 2 DS running on MC 14.4.4 that manages 4200 Android devices.

According to Advanced configuration we have set DS server priorities different for a subset of devices. It guides half of devices to connect in DS1 and half in DS2.

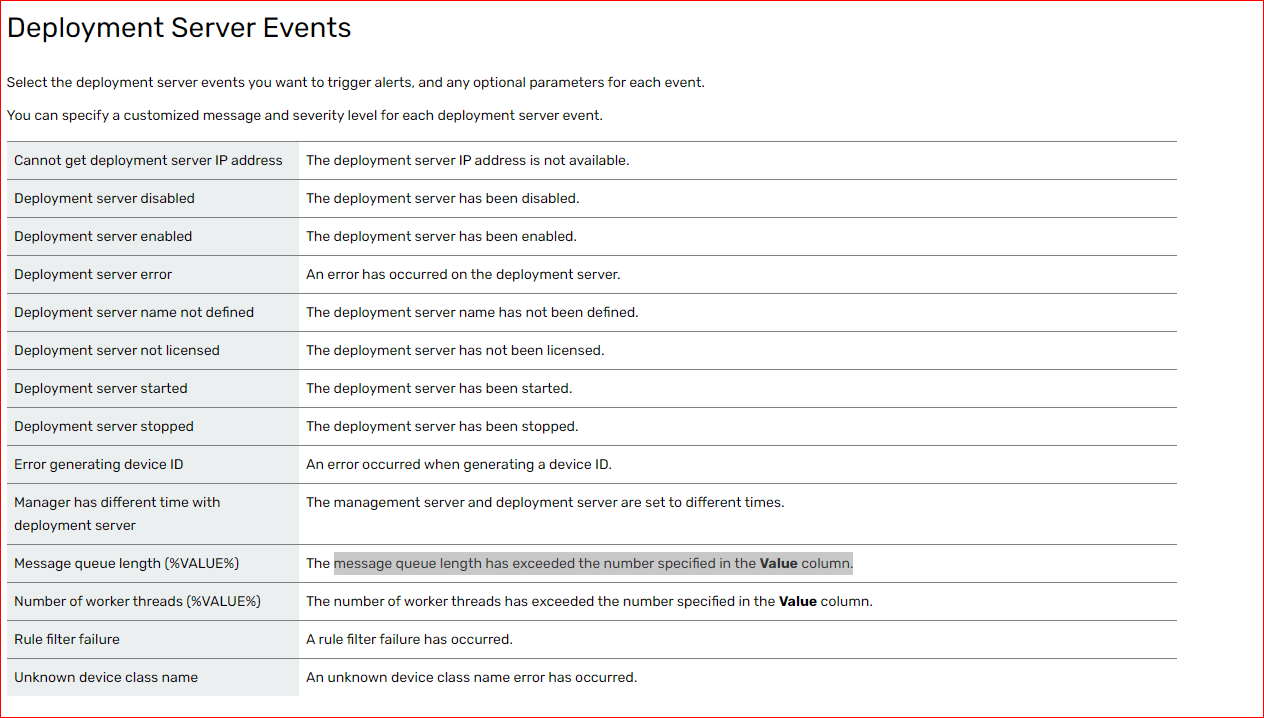
One of the DS is always with many itens queued (around 1000) and other is almost none.

We have tried to invert the server priorities and the behavior of queue size follow it.

Both subset of devices has rules and profiles locked by kiosks.

Is there any way to see what kind of task is in the DS queue? In positive way, we would be able to review the rule/profile or split the subset in a different way.

4 years ago
SOTI MobiControl
ANSWERS
RC
Raymond Chan Diamond Contributor
4 years ago (edited 4 years ago)

How did you observe your DS queue size?  What is the measurement interval?  How many such measurement data have you gathered?

Is there any hardware load-balancer in your dual-DS system?

Are the two DS having same CPU (in terms of number of cores and clock speed) and RAM?

Have you checked the %CPU utilization graph  of your two DS servers? If so, for how have you observer?   Is any one appoaching 100% with certain patterns?

Are some of your 4200 devices assigned some policies required very different cpu loading than others?

R
RRMOD@SOTI
4 years ago (edited 4 years ago)

Hi Joao Nelson,

Thanks for posting in SOTI CENTRAL,

There can be several reasons for High Queue Length depending on the Profiles and Rules setup for different environments. The most common ones are below:

  • Device Check-in schedule: If all the enrolled devices are scheduled to check-in at the same time, depending on the number of devices, it may result in high queue length. It is always a good practice to distribute the device check-in schedule with some time differences at the group level
  • Profile Deployments / Data Collection Rule: If a profile is deployed to a large number of devices, or a profile is updated and applied to a large number of devices, it may lead to high queue length as the DS starts pushing out the changes to all the devices simultaneously
  • Application Catalog Rule updates: Depending on the number of devices, an App Catalog rule update may result in high queue usage and you may notice the applications taking some time to be deployed to the devices, provided the network bandwidth is not an issue.

MobiControl allows to setup a Deployment Server Event Alert to be generated every time the server queue length goes beyond a certain threshold (which can be manually specified). This alert can be helpful to know which recent changes made to the environment cause the high queue length and preventive measure can be taken for the next time while attempting similar changes. Please refer to the image below for an instance

In addition to this , You can also create a support case(click here) or call SOTI Support team(click here) to have SOTI engineer look into the logs to find which events triggers high Queue length.

Also, if this post has helped you in solving your inquiry, I would request you to mark the particular comment as "is solution", so others may benefit from this information.

They are not in load balance.

It is checked continuously at each 5 minutes, being collected for the last 14 days.

I have splitter devices by application in order to set server priority. Then I have inverted the priorities between the sets. The queue size follow the set of devices.

I may decrease the size o the sets until to find which subset promotes the queue size, but it looks like I have already found which set is responsible for it. Just could not find which profile, rule or content library is responsible for it.

The CPU only increases in Management Server. It means, even when swap the server priorities, the cpu remains the same level as 30% to DS server only and around 80% to DS+MS Server.

The DS+MS server reachs 100% CPU when many(around 500) cel phones are connecting simultaneously (as 07:30 AM), for a period shorter then 3 minutes.

The answer for question regarding some devices request more cpu then others is positive, but not identified what may produce it. They looks as similar to the others. So that is the reason my Post of identifying what is in the queue.

RC
Raymond Chan Diamond Contributor
4 years ago (edited 4 years ago)

Hi Joao,

Your answers to my questions do clarifiy your situation and measurement methodology reasonally well now.  The amount of measurement data you collected sounds sufficient and representative. 

As different items in the DS queue likely need different cpu power to serve and there are usually large number of such items sporadically queuing up,  it is often very difficult to spot the problem from any related log file even if such log really exist.  So what you ask for is unlikely to be able to help you solve loading problem in practical sense.  Your problem gets even more complicated because one of your hardware server also host the MS, so the two server are intrinsically not load balanced even if you assign 50% of devices to each server for every policy you configure. 

So, your real problems should be 

(1) To identify if there is any REAL loading problem.

(2) How to identity the possible cause(s) if there is really a probem

(3) Is there any fix to such real problem

For (1), you should capture  cpu/memory/network utilization loading data from MS-Windows system utility whenever something peculiar happen, which can be easily identified with MobiControl alert rule.    To monitor the loading and any possible sub-optimal policy configuration on Mobicontrol server , I always recommend my customers to set up alert rule to monitor not just the "message queue length" as mentioned by RRMOD@SOTI, but also the "number of worker threads".   Whenever there is such alert, the first thing to do is to monitor if there is any occurence pattern in terms of absolute time or time-interval (e.g. occur every 15 minutes or every 2 hours, etc.).

In your case, since the CPU loading is just 30% for DS and 50% for MS, there is no REAL loading problem. So, you don't have to consider adding memory/cpu power to existing DS, or adding a third DS.    

If your policies or use case involves some real-time requirements that cannot tolerate the 3-minute period at around 7:30 a.m. during which the cpu utilization hits 100%,  you have to solve problems (2) and (3) mentioned above.

For (2), since the problem happens daily at around 7:30 am,  just look into different cpu-intensive or data-intensive policies (typically data-collection rule, file-sync rule, big package deployment in scheduled profile, schedule-update advanced configuration, etc.)  to locate which one(s) is/are scheduled to happen at 7:30 a.m.  There can be more than one such policies.   Once identified, try to offset or stagger the schedule time of such policy for some portion (say 33%, 50%, etc.) of targeted devices/device-groups by say 5-10 minutes, which should be sufficient as your peak 100% utilization just last for around 3 minutes.  This should be the answer for item (3).

If the peaks happen with regular intervals (say every 2 hours, etc.), one can narrow down the policy hunt to only those that have similar scheduled interval.  If the peaks happen sporadically with no pattern and last for untolerably long time exceeding some real-time or near-real-time requirements,  then one might need to consider upgrading  cpu/memory/network or relocating/adding DS based on the cpu/memory/network utilization data pattern measured.

I hope the above shed some light on how to practically tackle a loading problem on MobiControl.

My real issue is the queue size never drops down near zero to a subset of devices. It means, there is no peak, but they are constantly high to that subset. Splitting this subset from others (something as 50% of devices is the subset), the other subset reaches near zero unrelated to which server priority I define to them.

Investigating rule by rule and profile by profile I could not identify what causes it.

If there was a way to check what is in the queue it would be possible to see the profile/rule responsible for it and try to get the same benefit of the profile/rule in a different approach.

As part of it, we also can not filter the events by type in Global Setting DS Logs. As it produces around 100 events per second, it is almost impossible to identify real issues happening at the moment. We need to filter by date and check yesterday, having a separate log the to check which peaks was what.

RC
Raymond Chan Diamond Contributor
4 years ago (edited 4 years ago)

Didn't you say in previous post  the CPU utilization hit 100% for 3 minutes at 7:30 am each morning?  Isn't that a peak? 

Forget about the queue size.  Who says each item should always be associated with one device.  Besides, queue size alone does not mean much, as one buggy task consuming 50% cpu resources has much more impact than 5000 tasks each consuming 0.0001% of cpu resources.   If the % cpu utilization is just a few percent (i.e. much less than 10%) most of the time, who cares why the DS queue size is non-zero most of the time.    You are the first guy in the last 10 years  I heard about who ask how to investigate details in the DS queue.  

I am not from Soti. Maybe someone from Soti can reply to you how you can find or enable such log.   If such log is there, I wonder how many lines you need to browse through, and whether you have the knowhow to understand what is logged there.   If I am skeptical about or even obsessed with the non-zero queue size, I'd rather spend time going through the options of all the policies configured to see if something unreasonable has been set to consume resources repeatedly.  I personally believe this approach should be more efficient than exploring the queue.

Thank You Raymond.

Your statement makes sense.

The issue its the queue may be large also due network bad performance.

I have looked a bit deeper, it seems the enlargement queue size is related to file size transfer. It locks the file to be transferred. As the file is large, it takes long to be transferred and if the connection breaks down in the middle (I have seen several communication error message), it does not release the file immediately. So the other device expecting to receive it, keep waiting in the queue up to MS gets a transfer timeout.

As there is no parameter to set to use cache memory to content library, and then to transfer several contents simultaneously, I believe I have found the cause.

 Due pandemic restriction, there are some videos being distributed by Content Library  that changes weekly/daily.

RC
Raymond Chan Diamond Contributor
4 years ago (edited 4 years ago)

If you have big video files updated frequently to large number devices with Content library rules,  then having large queue count for long period of time is not uncommon.  In fact, it is easy to spot these if you look into the I/O or network utilization statistics reported by MS-Windows Server in parallel with the CPU utilization.   You might be able to reduce loading/traffic by changing in the corresponding Content-Library rule(s) the files to be deployed on-demand rather than always pushing the file. 

Breaking very big files into smaller ones may also help in case the connection quality is exceptionally poor such that very frequent retrys need to be done.